Technology Overview
Introduction
This section will touch upon how Kraken.io built and scaled an image optimization and compression platform which serves millions of requests per day, with the goal of maintaining high performance at all times while keeping costs as low as possible. We present our infrastructure as it is in its current state at the time of writing, and touch upon some of the interesting things we learned in order to get it here.
Hardware
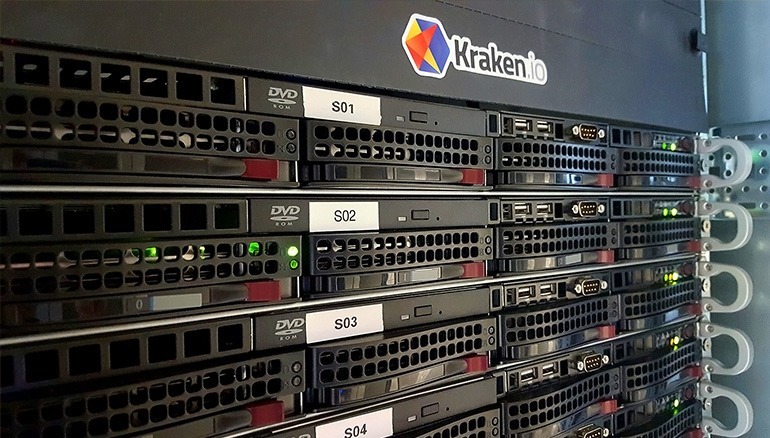
Image optimization, compression, and even recompression of formats like JPG, PNG, GIF, and WebP have enormous processing requirements. Cloud was never an option for us as we are continuously trying to lower our total cost of ownership.
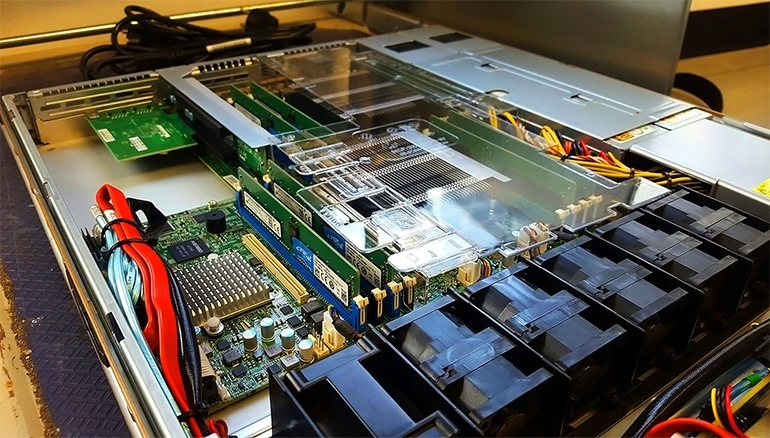
All single-socket machines (API, Web, Load Balancers, Webhook Delivery) are currently running Xeon E3-1280 v5 (Skylake). For the Optimization and Compression Cluster where all the hard work is done we use 2 x Xeon E5-2697 v3 per machine with 128 GB RAM and four SSD hard drives in RAID-1 setup for mirroring. With HT enabled the above setup gives us access to 28 physical cores and 56 threads per Cluster machine.
Kraken.io's platform is both CPU and I/O intensive, performing heavy processing on a large number of files. To gain more performance on the I/O level we will be rolling out PCIe-SSD drives for our API, Cluster and Storage machines.
Data Store
We use MongoDB in a Replica setup on three independent machines as our primary data store. As our dataset is relatively small and we use capped collections for all time series data DB sharding was something we never really have considered.
The second data store is Redis in a Sentinel setup (for the same reasons as the above). Used primarily as a message broker for the task queue and session management on Kraken.io frontend.
Provisioning, Discovery and Software Deployments
Every new machine we install is managed and configured by Foreman. We keep all the configuration in Puppet so bringing a new machine to production-ready state only takes a couple of clicks.
Software deployment is done through Capistrano. We use similar recipes for almost all our applications as all applications are written in Node. Integration with Slack is very helpful when we need to pinpoint a specific deployment that happened in the past and correlate that with the data available in ServerDensity or ElasticSearch.
File Storage
In a previous generation of Kraken.io we used to store optimized assets directly on the same machines that did the optimisation work. As we've decoupled the roles (API, Web, Processing Cluster and Storage) we've found ourselves in the immediate need of a scalable network file system. GlusterFS was easy to setup and it is easy to maintain.
We have millions of images flying over the wire from application servers to GlusterFS machines. It is very important for us not to move those files too often. Once saved in Gluster an image stays there until its automatic removal.
Load Balancers
Both external and internal load balancers are Nginx-based with Keepalived on each one of them. Even if both of our externals go down the internal ones will automatically promote themselves and also serve the public traffic.
We don't use any HTTP servers on our internal machines. All the internal traffic is reverse-proxied from load balancers directly to Node applications.
Networking
As we're also redundant on the uplink level (two independent 10 Gbps uplinks) we needed at least two switches per rack and two Ethernet controllers per machine. As the racks grow and each machine occupies five ports on the switch (BMC, Uplink A and B to Controller 1 and Uplink A and B to Controller 2) currently we're running four HP ProCurve switches per rack.
Monitoring and Alerting
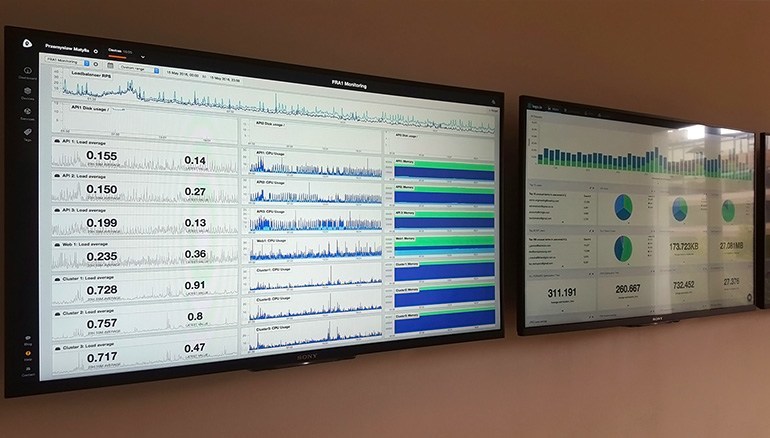
In the previous generation of Kraken.io we used Sensu, Graphite and InfluxDB. As we wanted to shift our full attention to the product itself and not maintain and monitor the monitoring tools we needed a SaaS that would take that pain away. After testing several services we finally settled with ServerDensity as our primary monitoring and alerting tool for all our machines and it works flawlessly so far.
Data Mining
As we try to keep the number of supported technologies to a bare minimum we use an external ElasticSearch provider. On an average day we ship 2GB of logs for further processing and data mining.
As we're constantly working on improving the optimization and compression stack we need to be able to immediately track the results of our deployments. At peak loads it is enough to do a small tweak in the Optimization and Compression Cluster and get meaningful data within a couple of minutes.